TRUST
A Los Angeles startup's app that connects businesses and content creators with a swipe
- For
- Let's Be Social Inc. · Los Angeles
- Role
- Product Designer · freelance
- Team
- Me on design, with the founders and their developers
- Tools
- Figma
- When
- 2026
Context
TRUST is the app by Let's Be Social Inc., a Los Angeles startup. It connects local businesses, mostly in hospitality, wellness and lifestyle, with content creators. It works like a dating app: the business swipes through creator profiles and, if there's a match, sends them a collaboration offer.
The problem
Its developers started building the app without a designer. When the first users arrived, big gaps and flaws showed up.
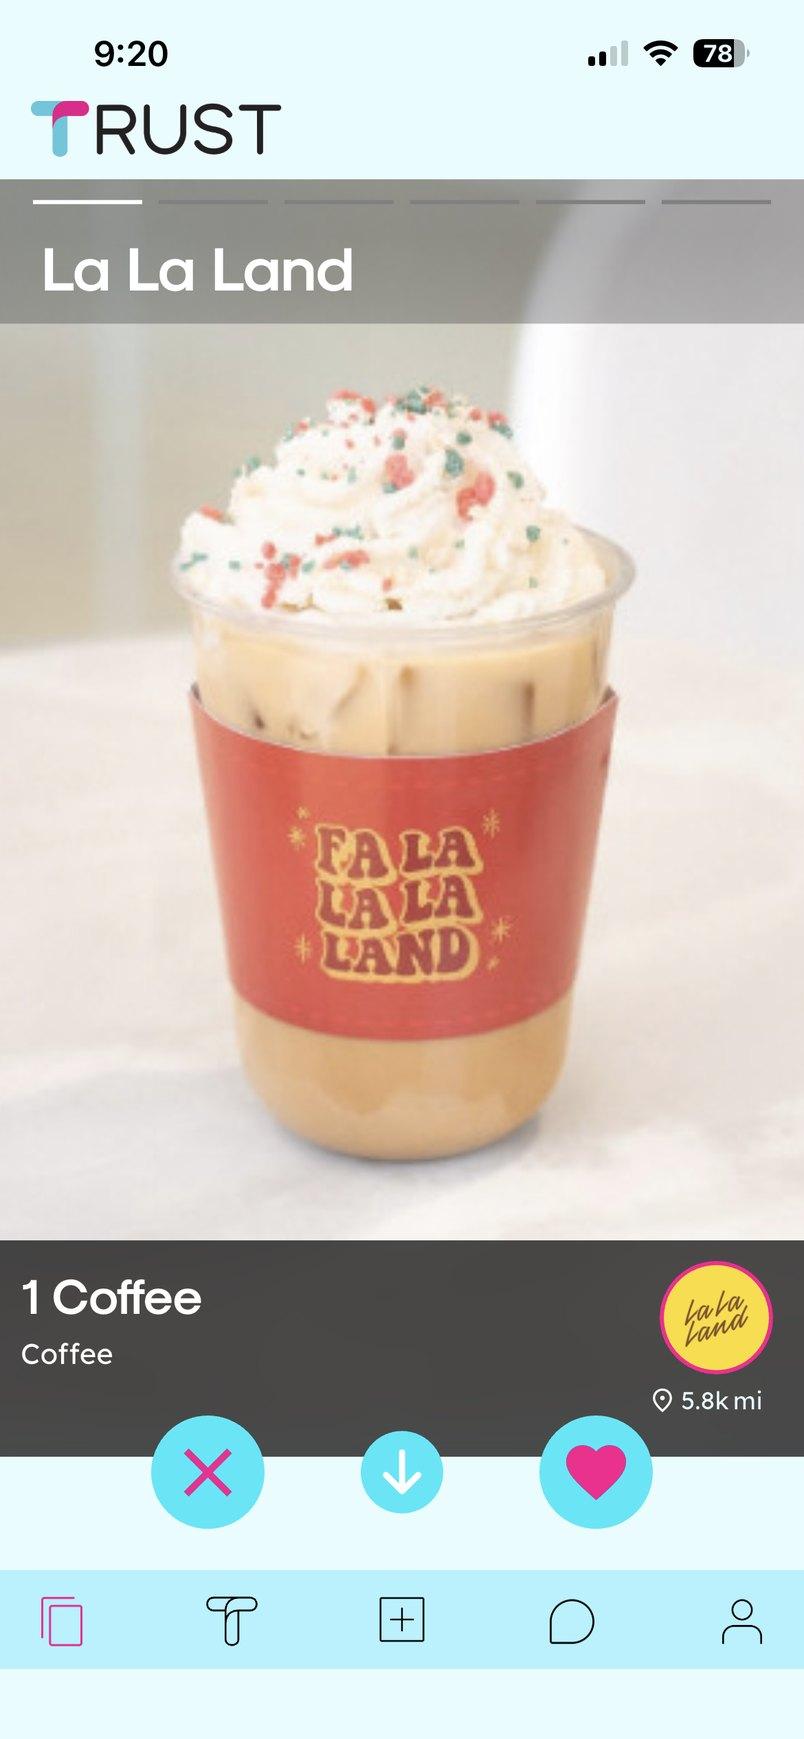
In the swipe, the photo was wedged between two strips on a light blue background, and the navigation bar had icons only.
My role
I was the only designer on the product. I worked as a freelancer, remotely and one assignment at a time, directly with the founders. The first, redesigning the swipe, was a trial. More followed, and with each one I built up a visual style for the whole app. Their developers kept building on their own in a style similar to mine, so I redesigned those screens too. The interface and the deliverables were in English.
The mobile app
The swipe, creator onboarding, the match and the review of each collaboration.
The web dashboard
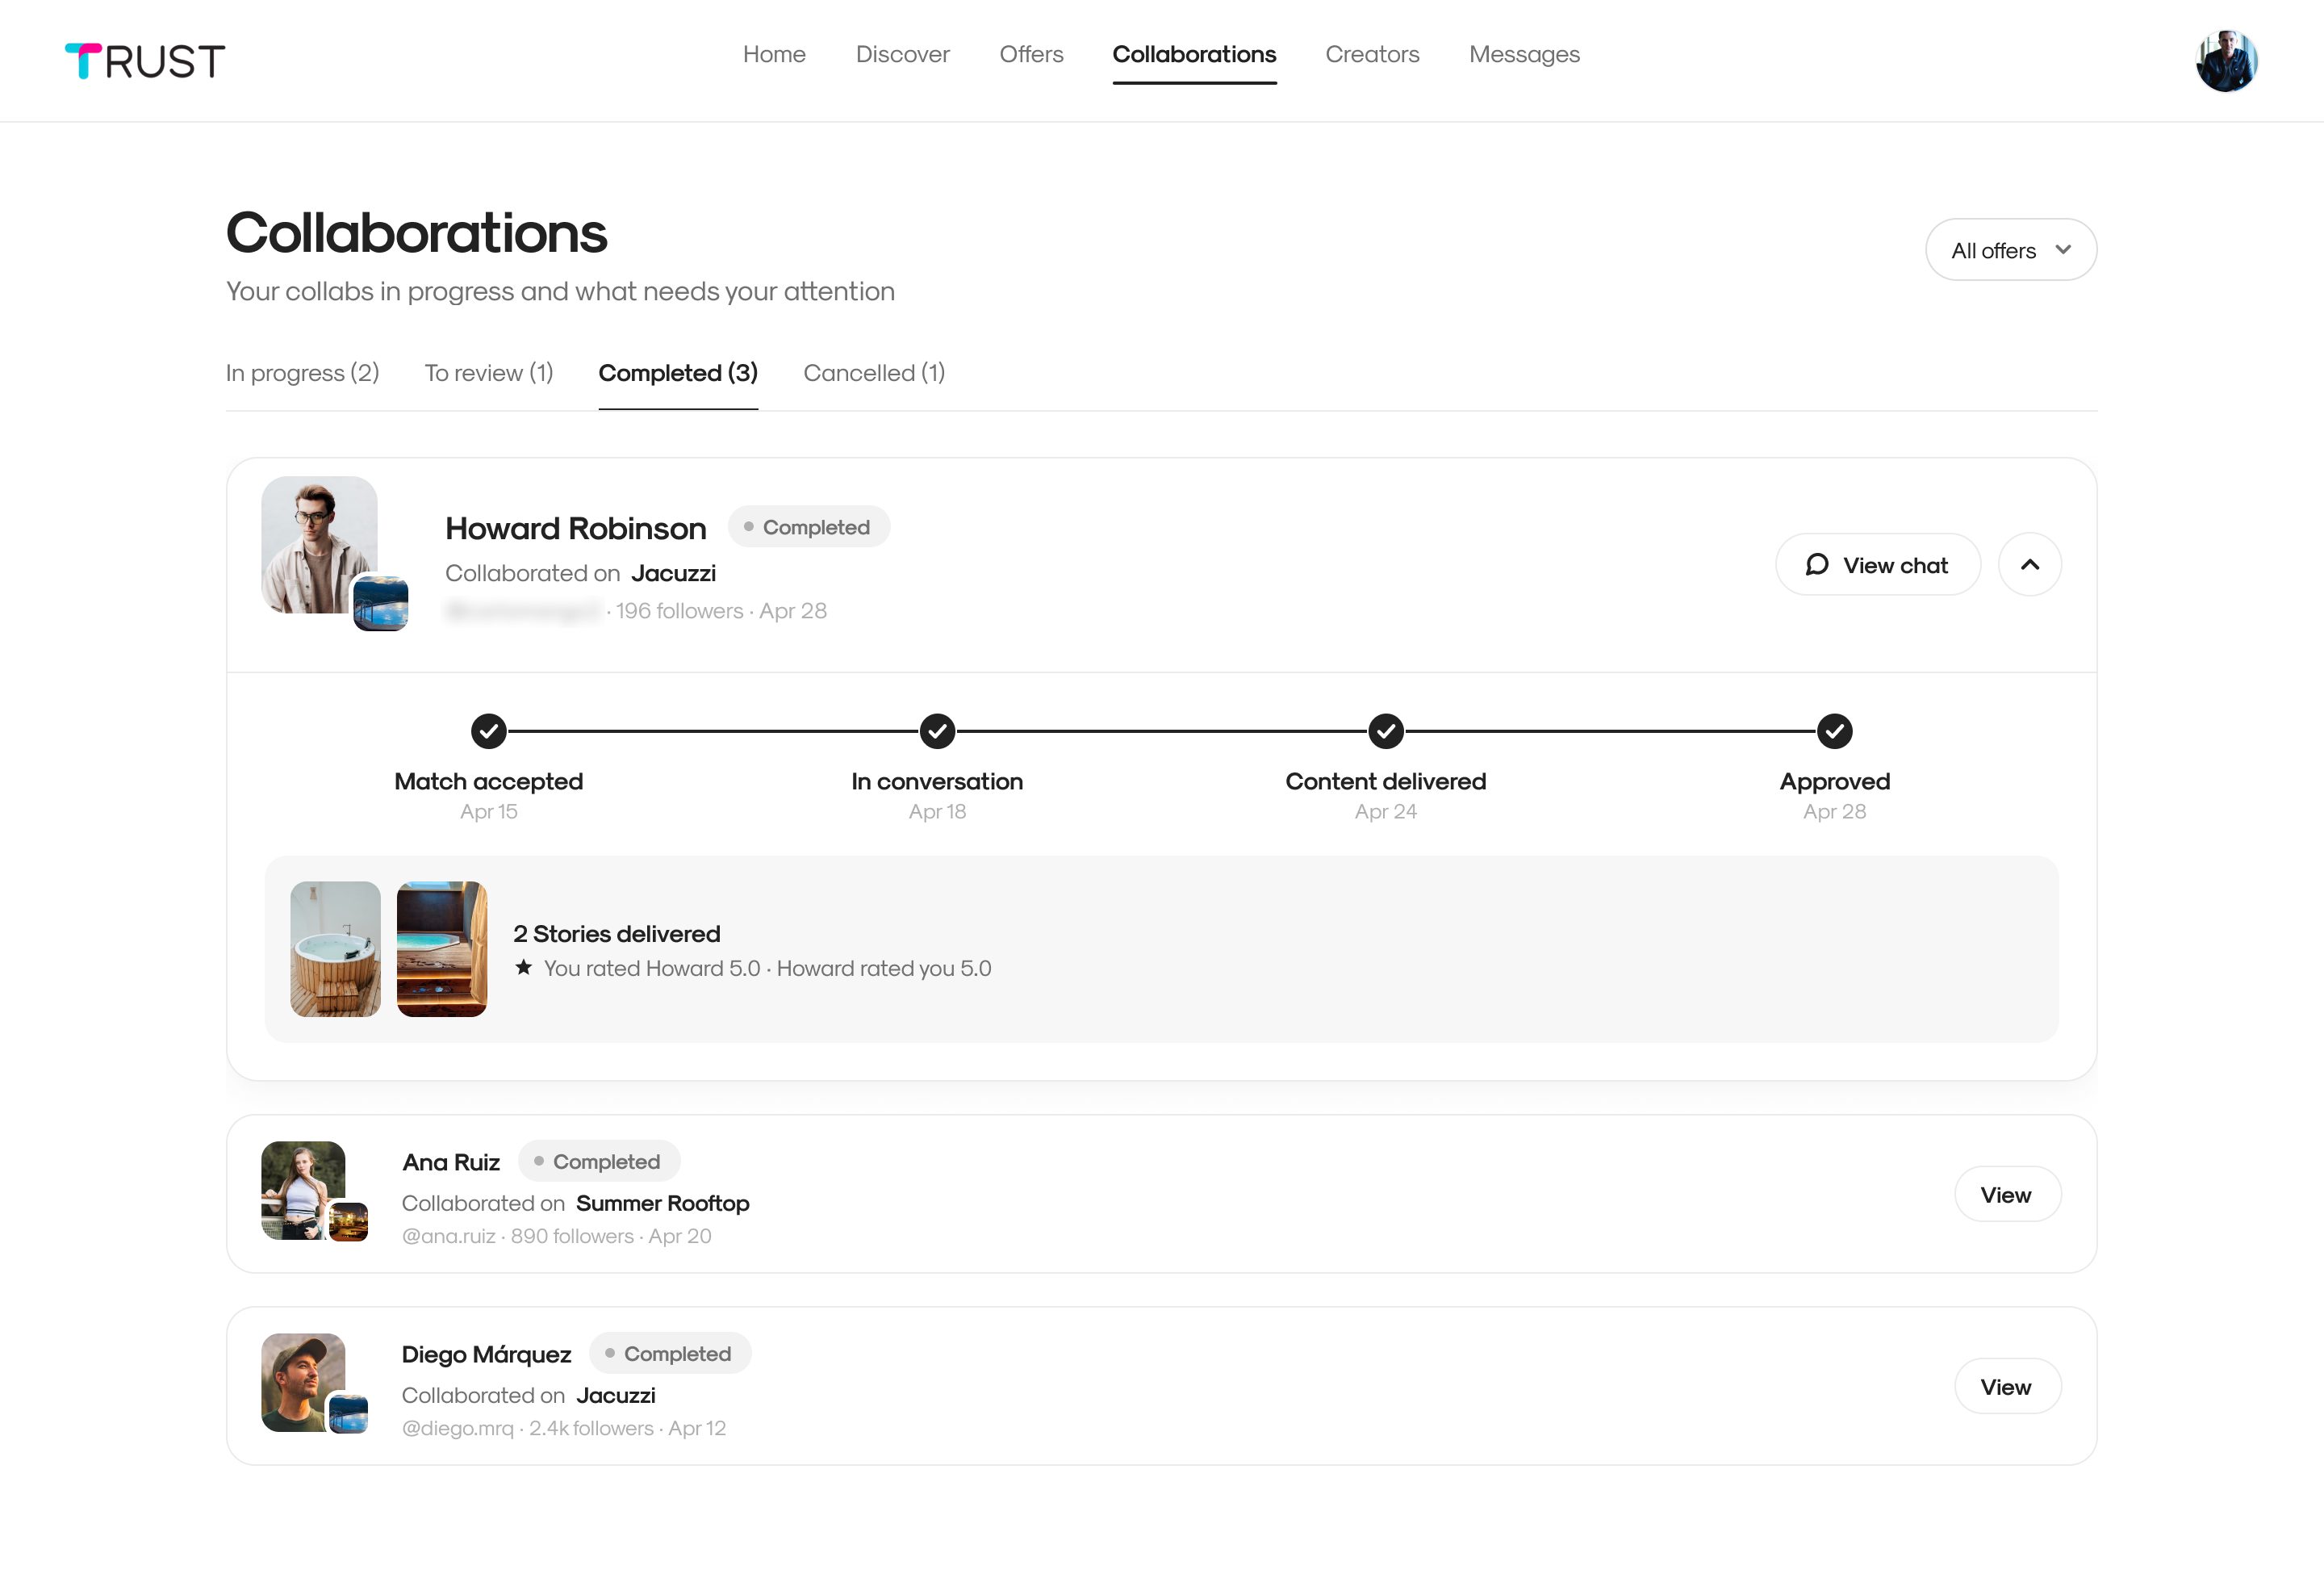
Discovering creators, posting offers and tracking collaborations from a computer.
The creator's metrics
Their performance section, on mobile and desktop.
The mobile app
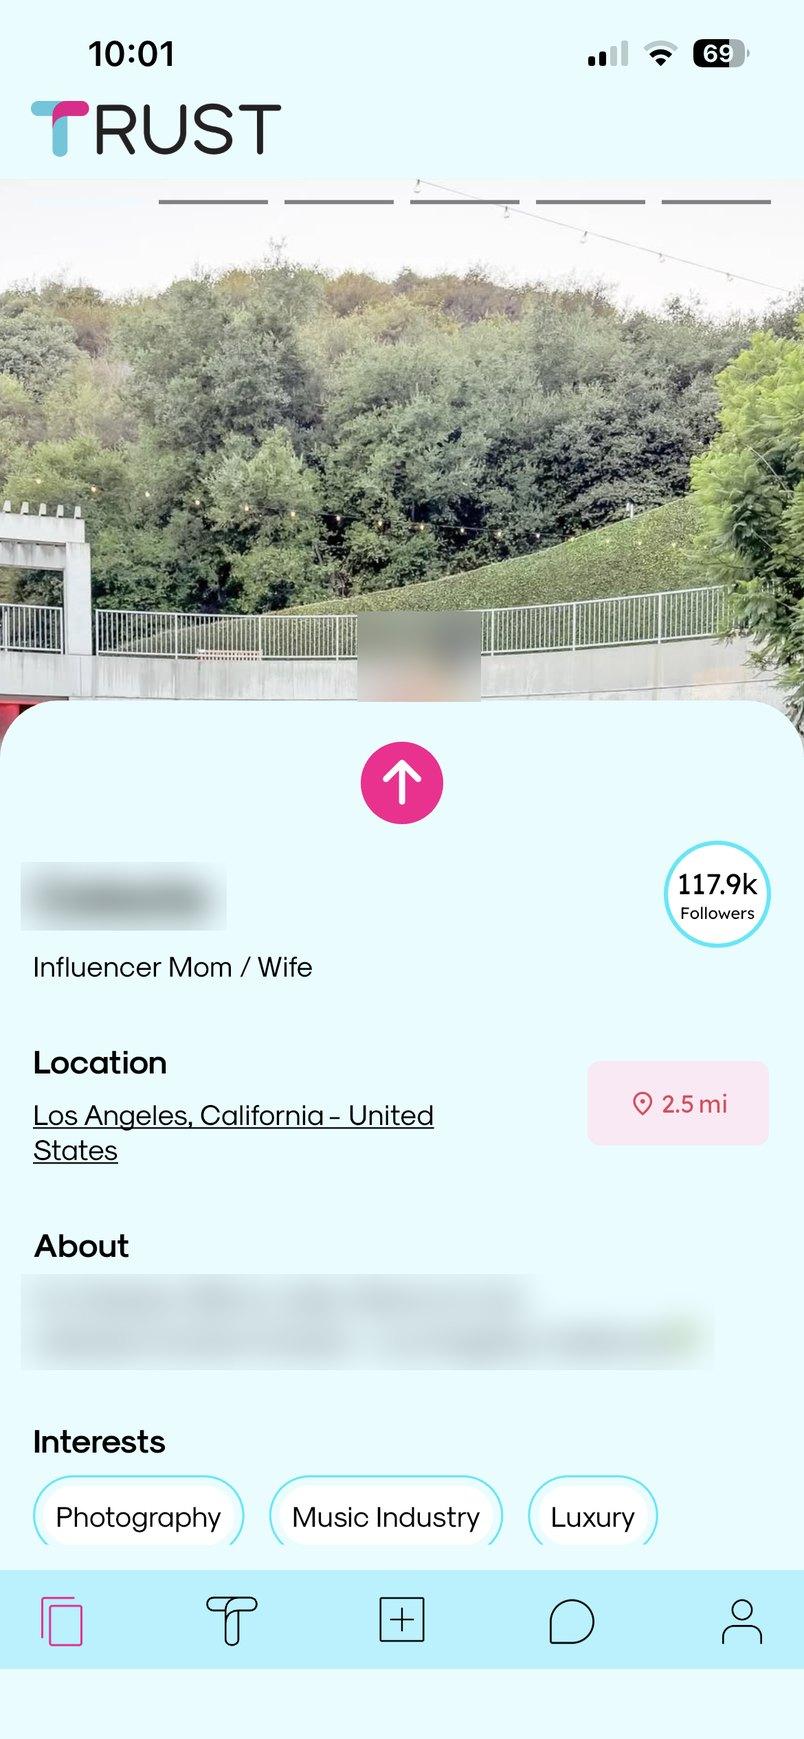
Swipe
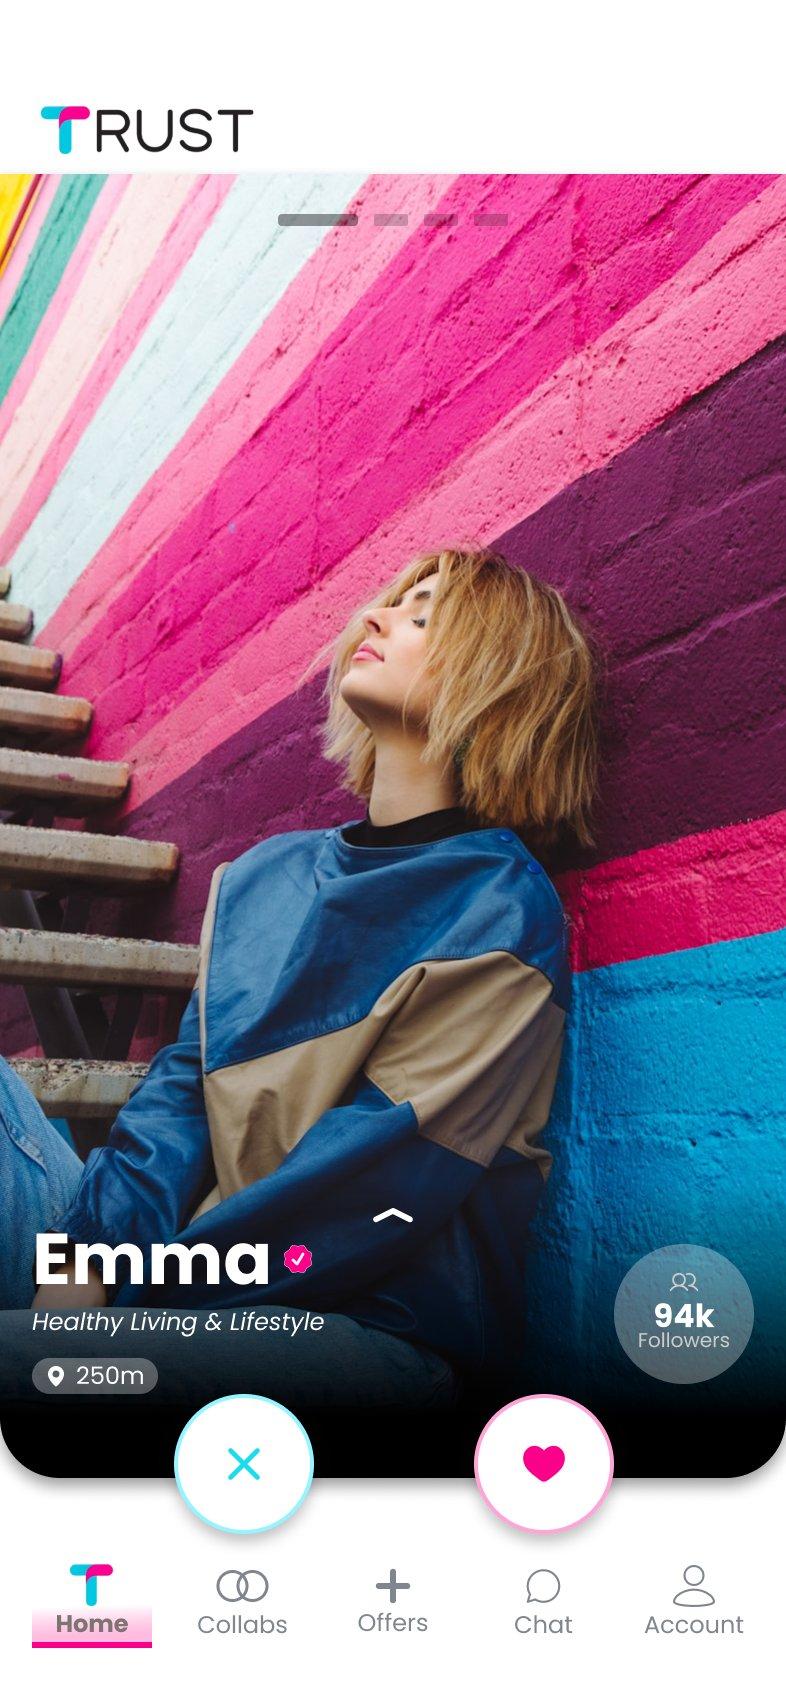
The photo fills the whole card, and the details sit at the bottom over a gradient: name, category, distance and followers. The buttons are two white circles, each with the color of its action, and every icon in the bar has its label.
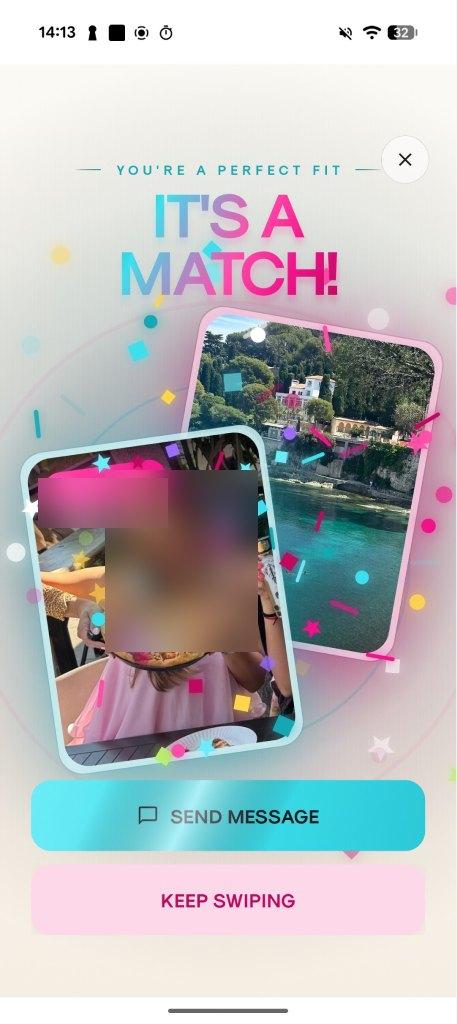
Match
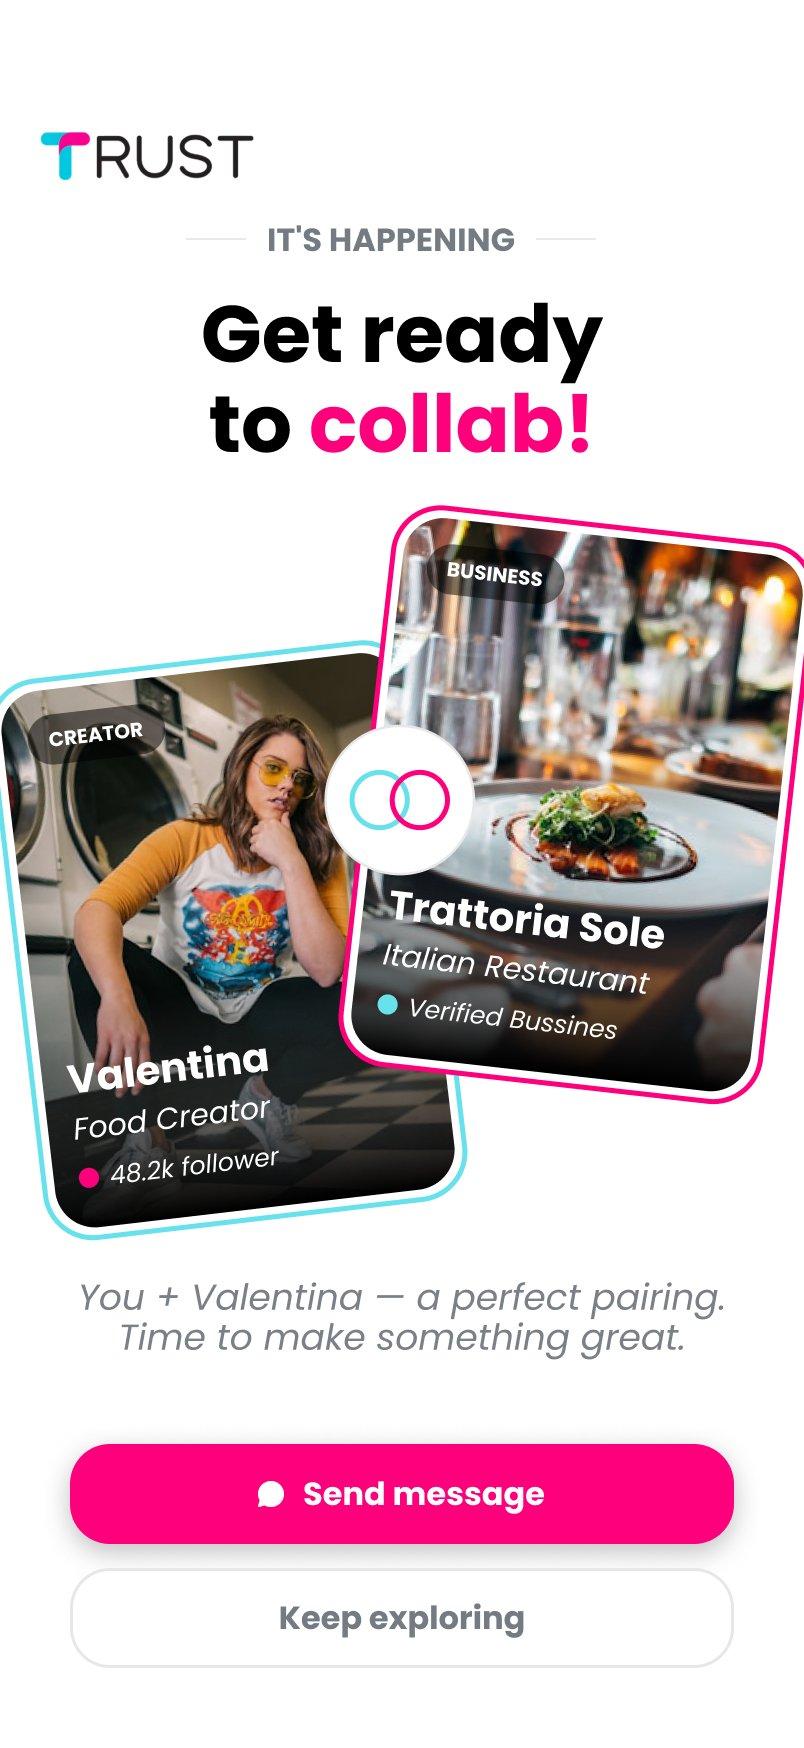
Their version celebrated with confetti and gradient lettering, but it covered the creator's name and didn't show the business. The new one puts the two cards face to face, with a clear button to start a conversation.
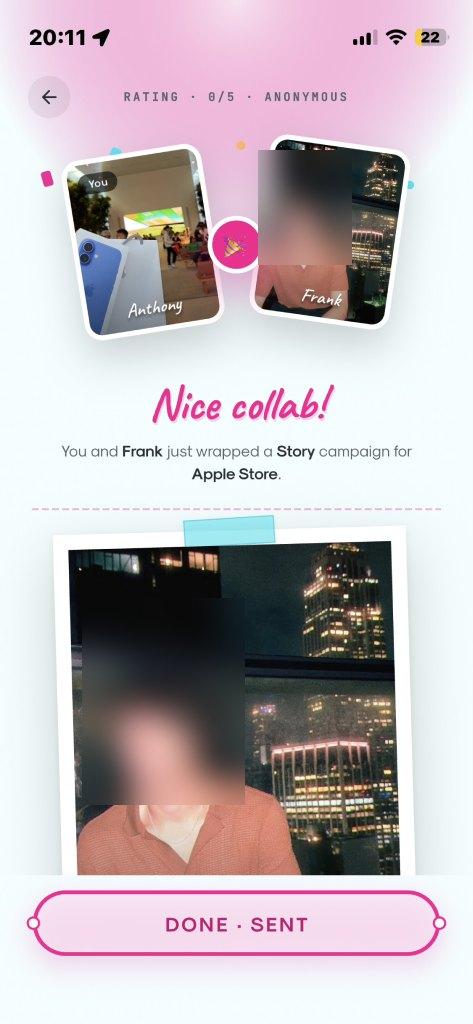
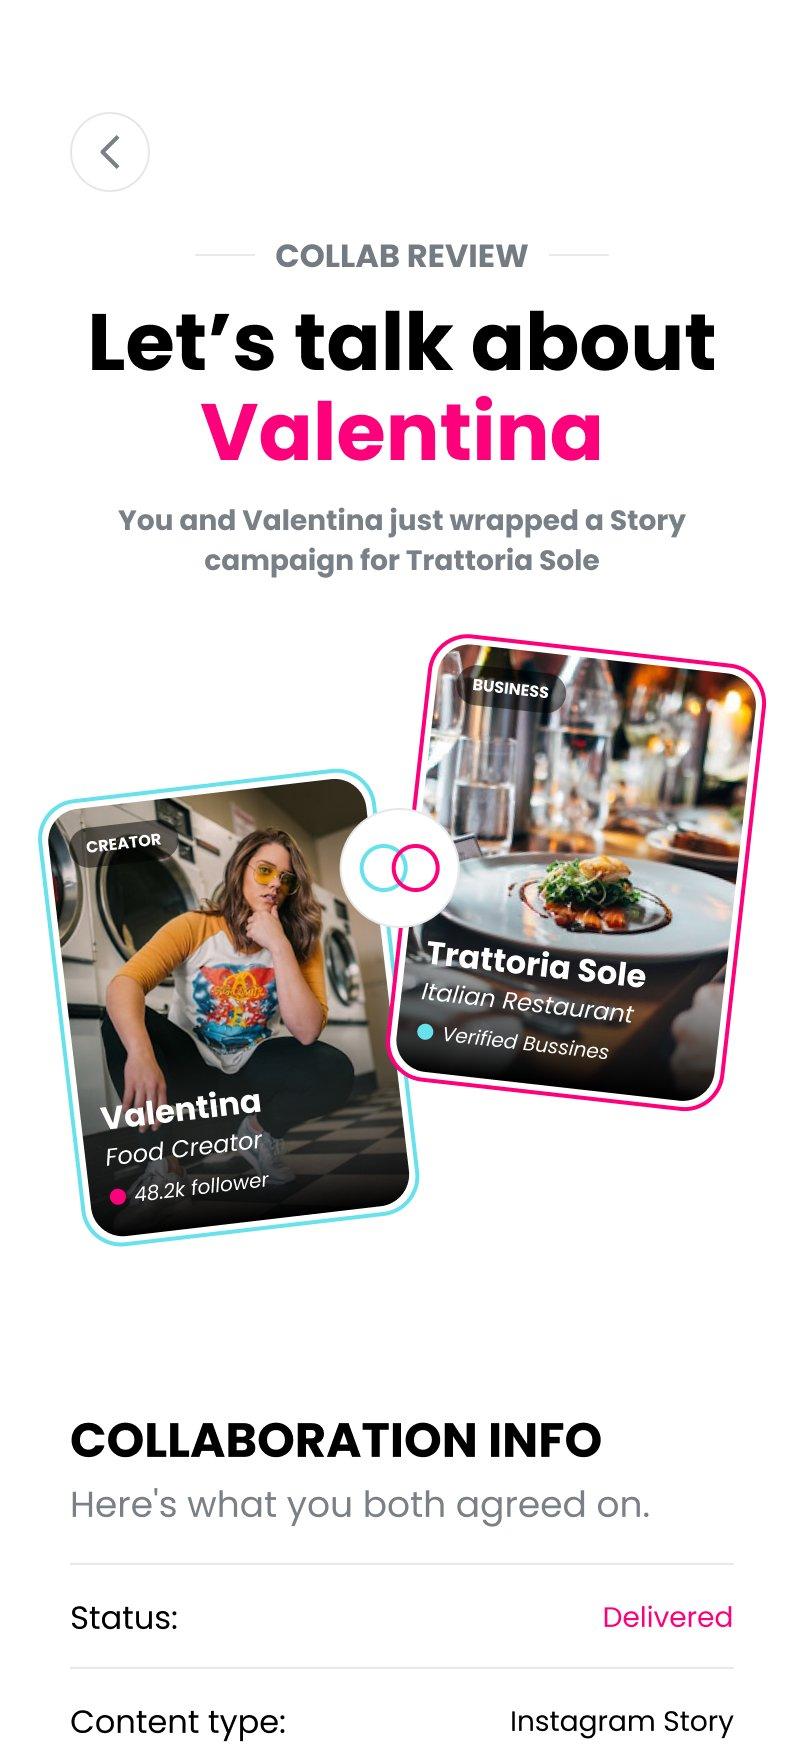
Review
Their version mixed four typefaces. I brought it down to one, with a summary of what was agreed and four questions: whether the content turned out well, whether it was posted on time, whether it fits the brand and whether the creator was easy to work with. Reviews go both ways and are one of TRUST's trust signals.
Onboarding and the end of the deck
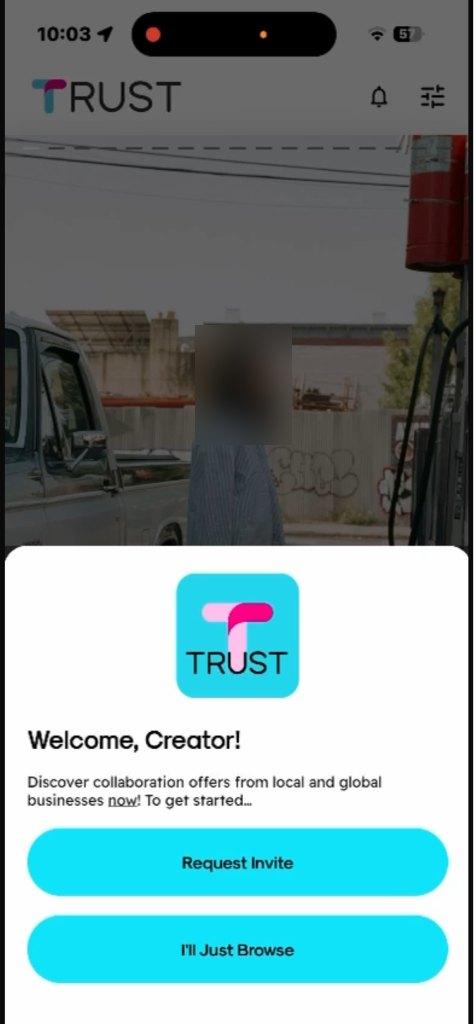
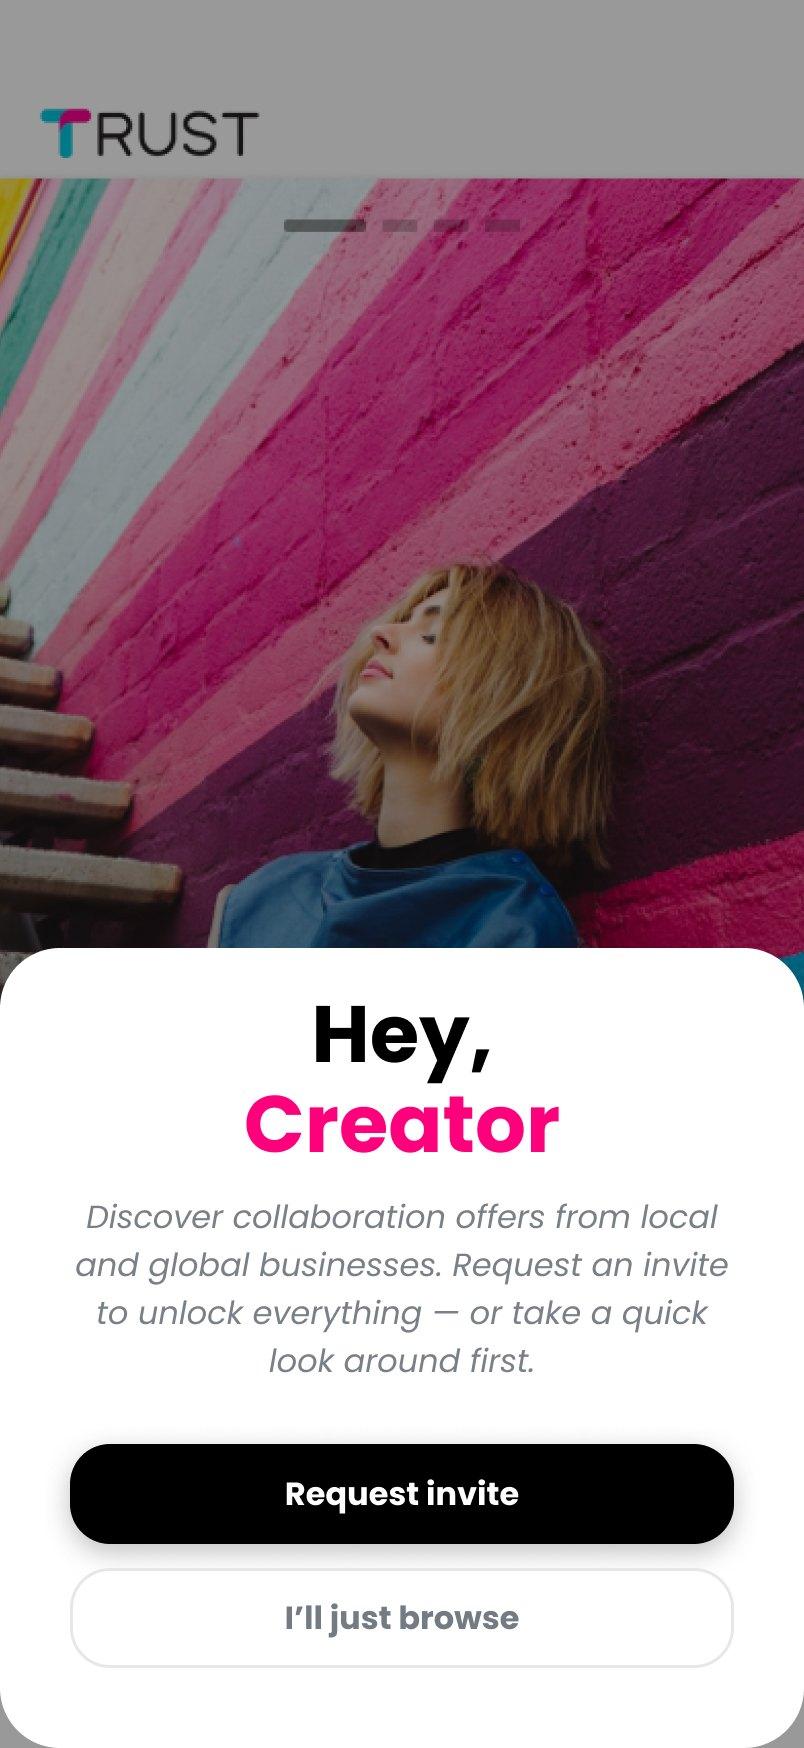
A new creator can request an invite or come in to look around in browse mode. The previous version only said that swipes there were “just for fun”.
Welcome
Their version had two identical buttons. In the new one, requesting an invite is the main option and browsing is the secondary one.
An offer, without an invite
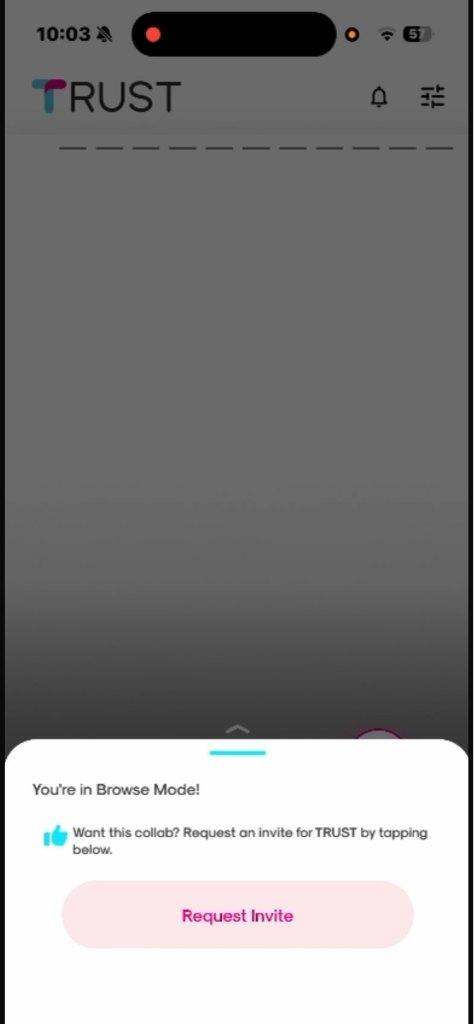
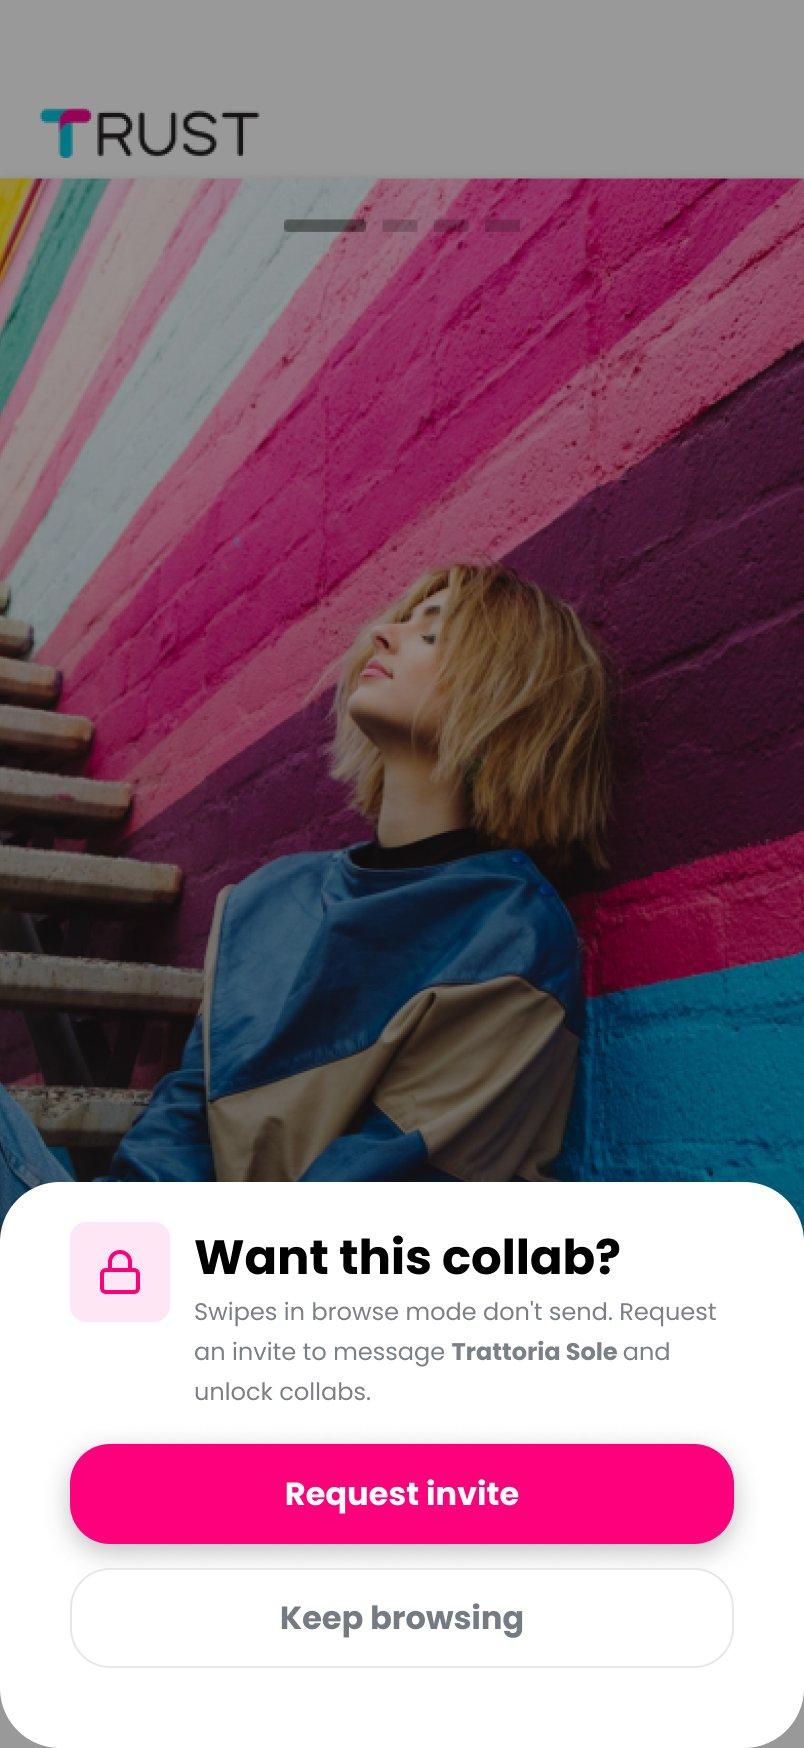
If the creator swipes on an offer in browse mode, the notice explains that the swipe isn't sent and what the invite unlocks: messaging that business and requesting the collaboration.
No more creators
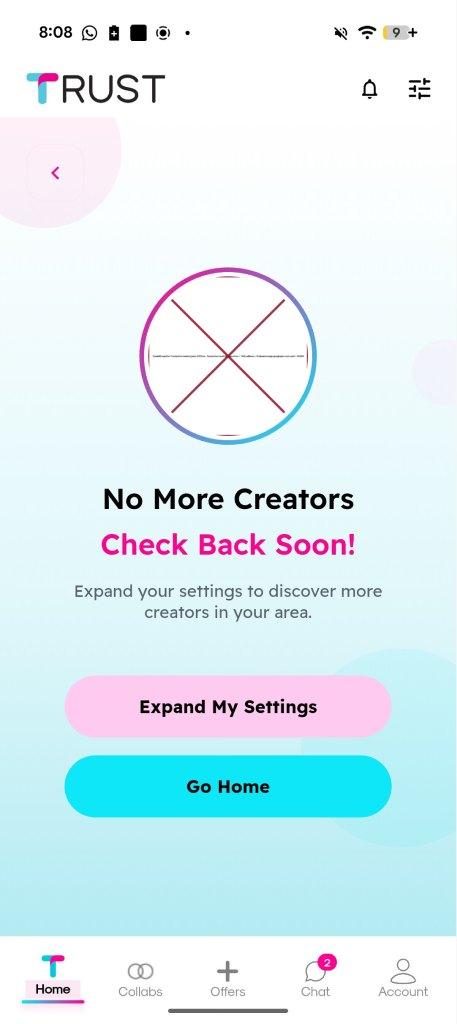
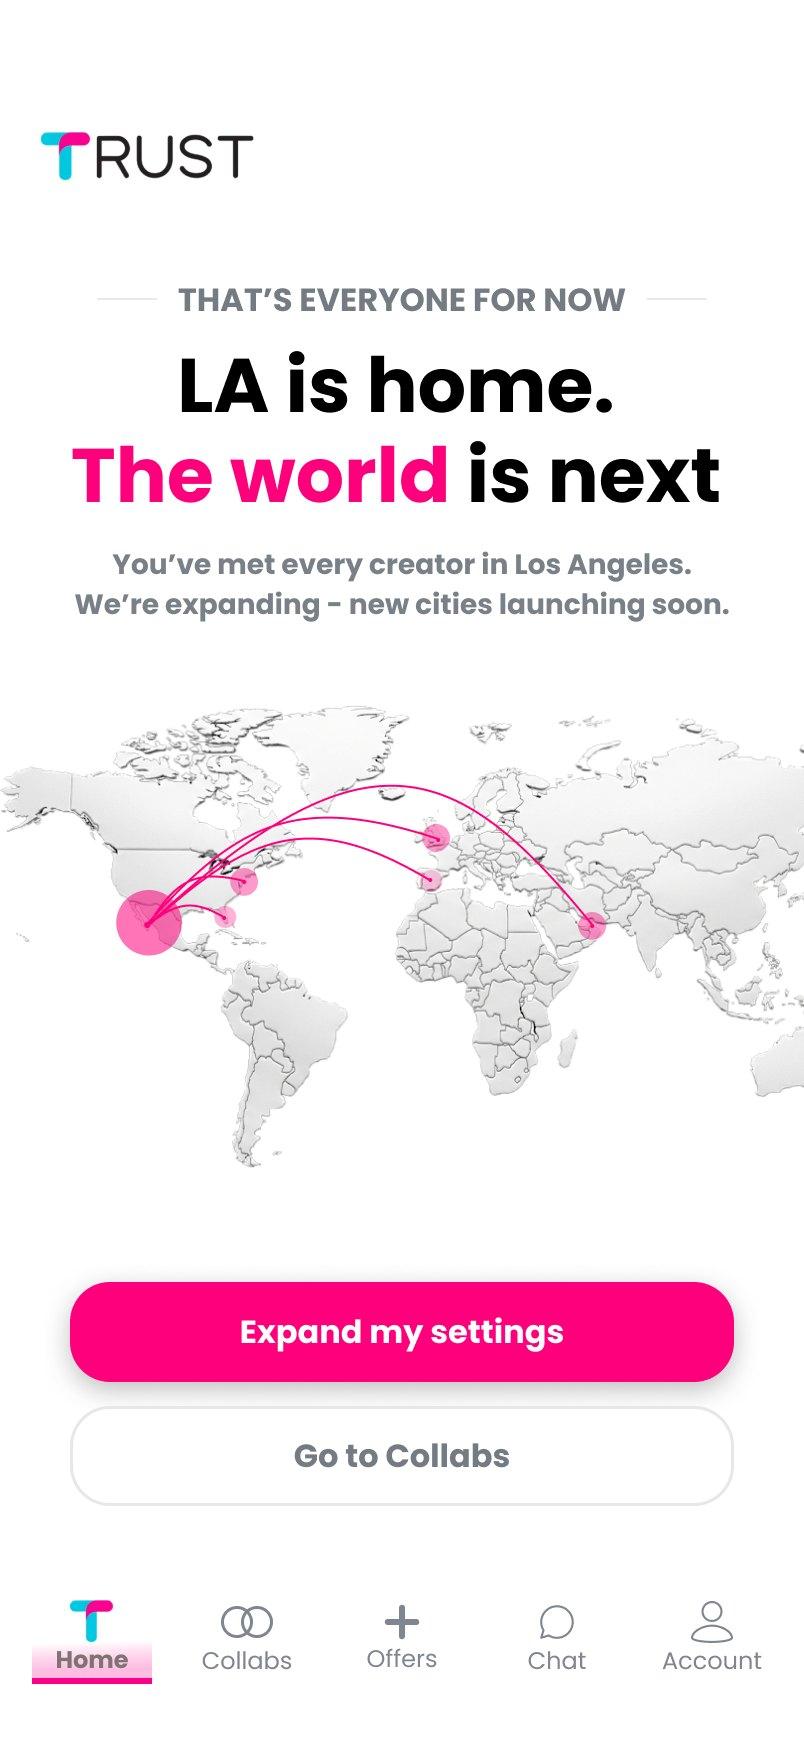
When a business runs out of creators, instead of a broken image and a “Check back soon”, the screen tells them they've already seen every creator in Los Angeles and that new cities are coming.
The web dashboard for businesses
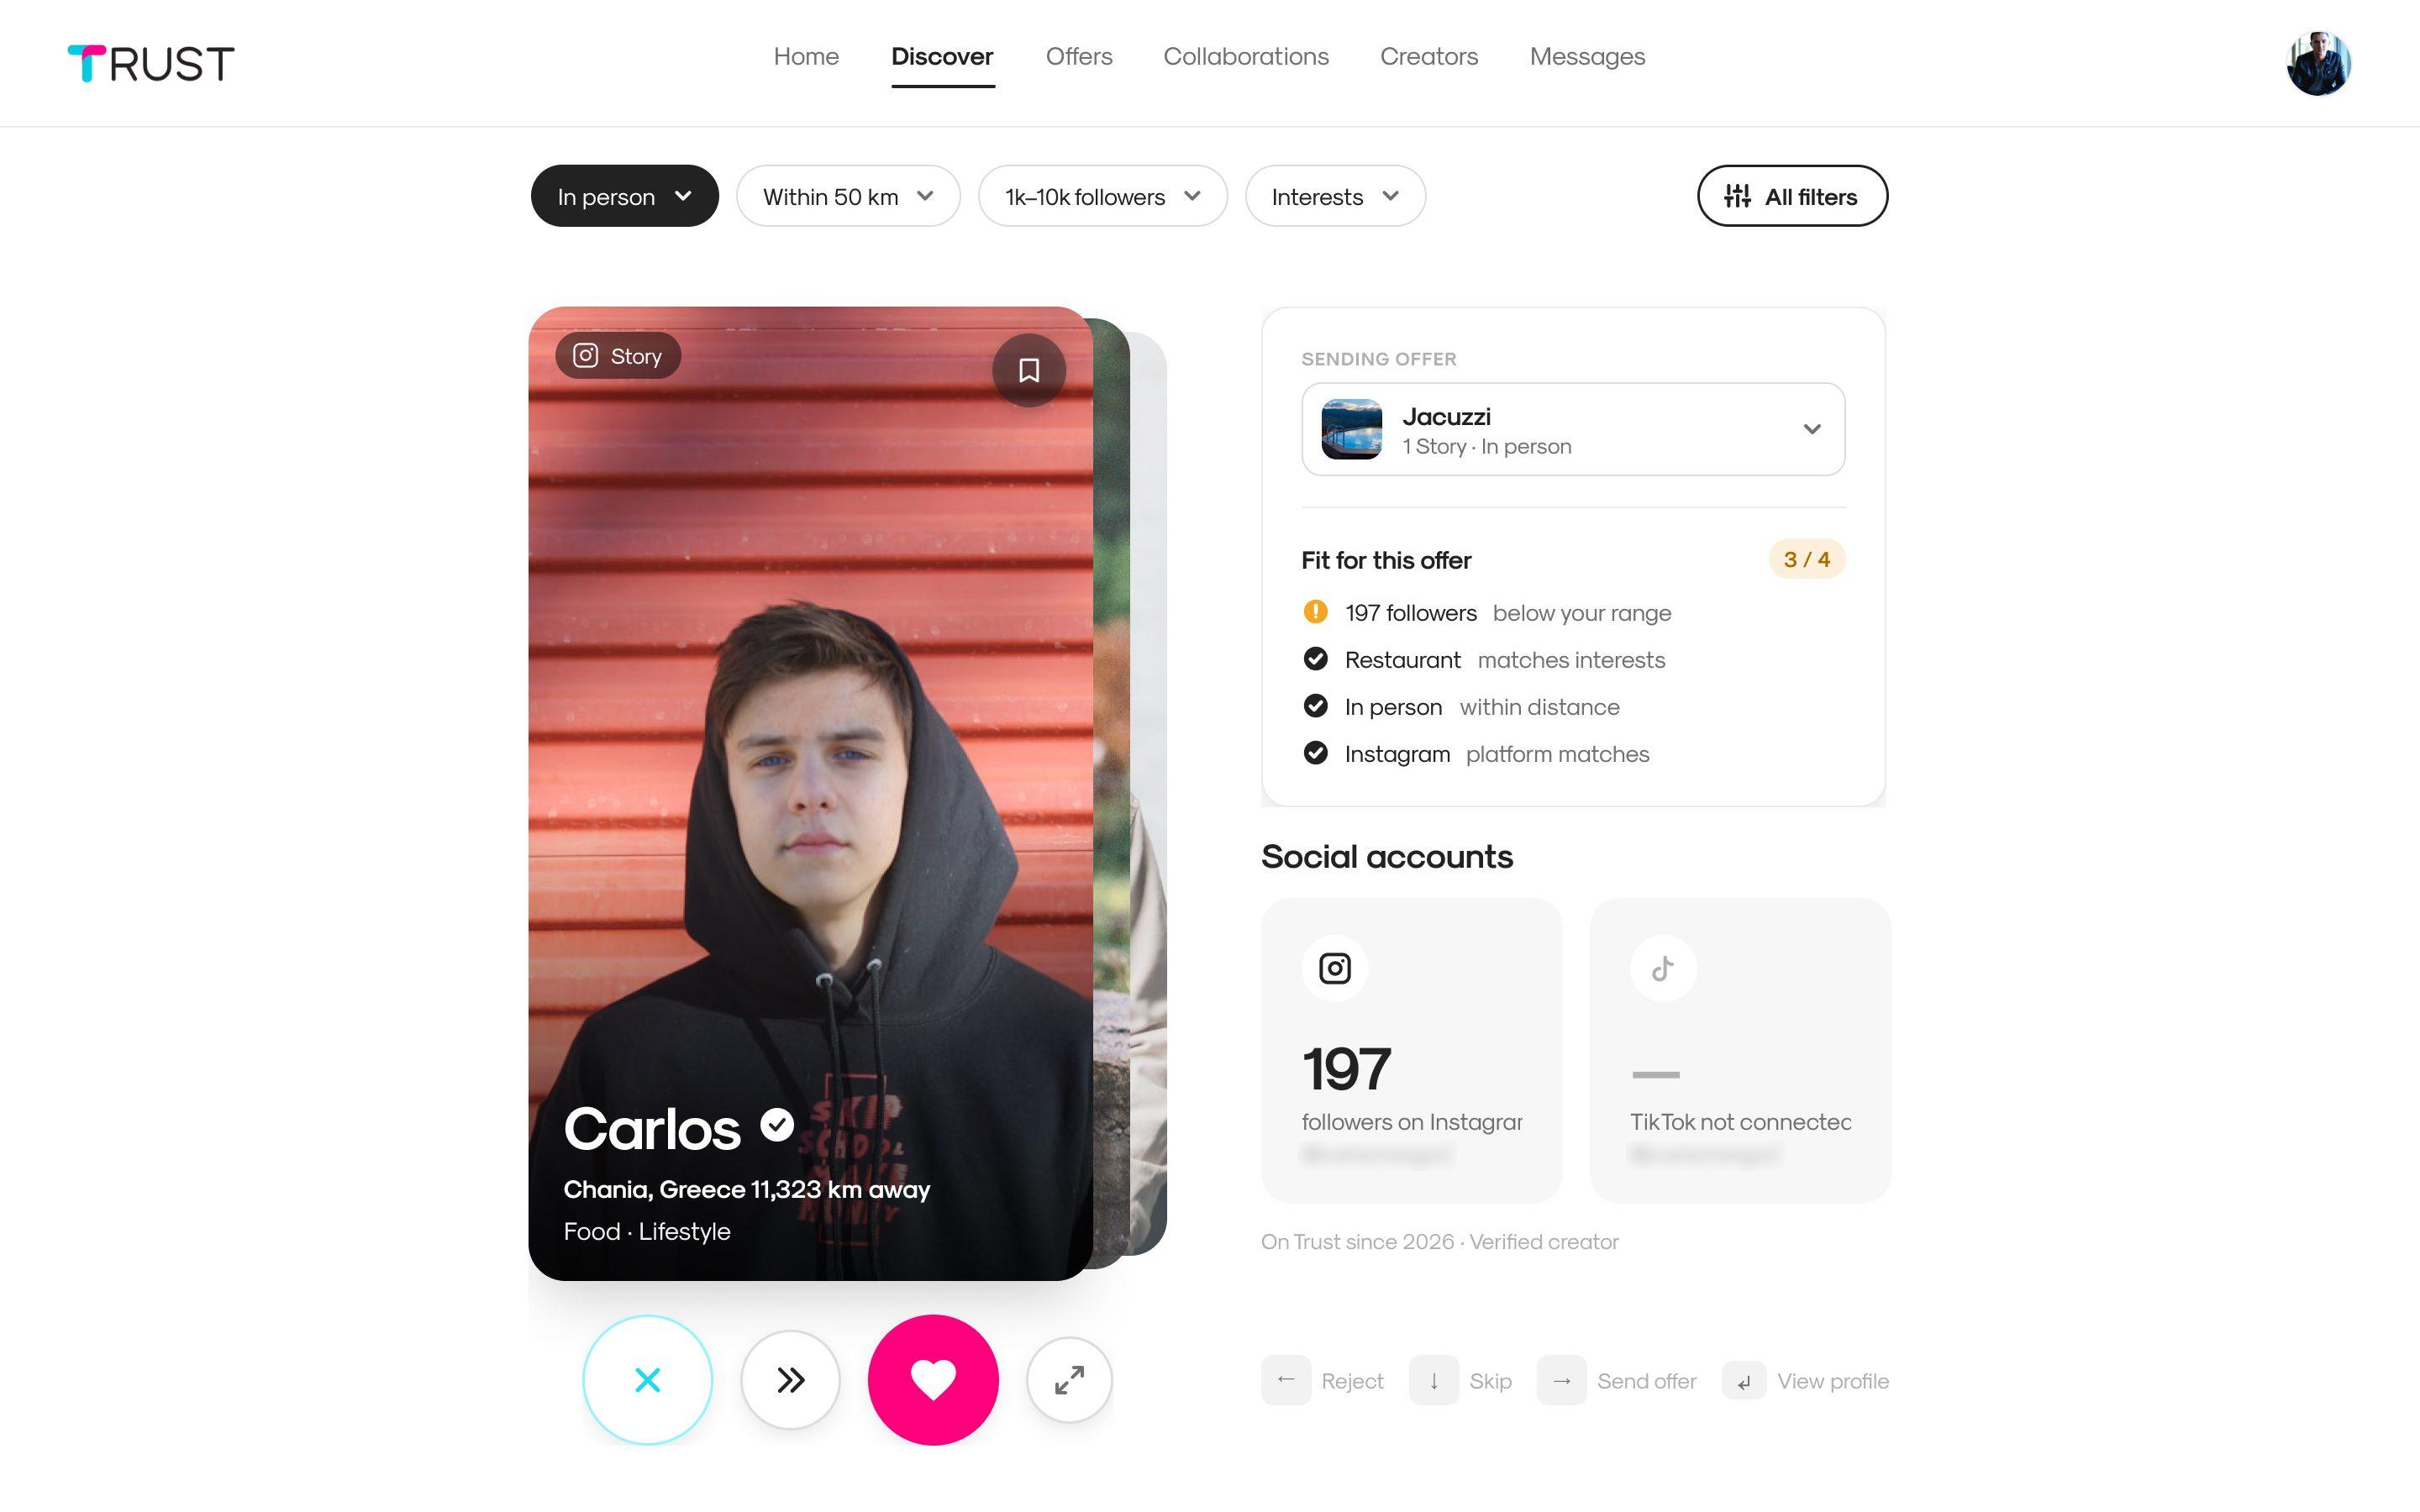
I redesigned the dashboard with Airbnb as a reference: lots of white space, hierarchy through typography, and the brand pink only for what matters, like sending an offer.
The swipe, with the keyboard too
The creator's card in the center and, next to it, the offer and how well the creator fits it: followers, interests, distance and social network. With no gestures, the arrow keys do the swiping: ← reject, ↓ skip, → send the offer.
The creator profile, in cards
In the first versions it was a single panel that got cut off on a 13-inch laptop. The final version splits it up and keeps the actions always within reach.
Offers and collaborations, connected
Offers is where the business sets up its campaigns, every now and then; Collaborations is the day-to-day. From each offer you can see the creators interested in it and its collaborations.
Creating and editing
Creating an offer is a four-step wizard. Editing it is a single-page form with a preview, so you can go straight to what you want to change.
Each creator's metrics
TRUST added a section to each creator's profile with their Instagram and TikTok metrics. It had all the data, but in a pink panel of about 45 rows one after another, all with the same weight and the values in pink too.
The most useful thing for a business, how that creator compares with the others on TRUST, was buried in the list. Negative changes appeared without context: there was no way to tell whether they were bad or normal. And TikTok sat in a small block below Instagram, even though the creator in the example had seven times as many followers on TikTok.
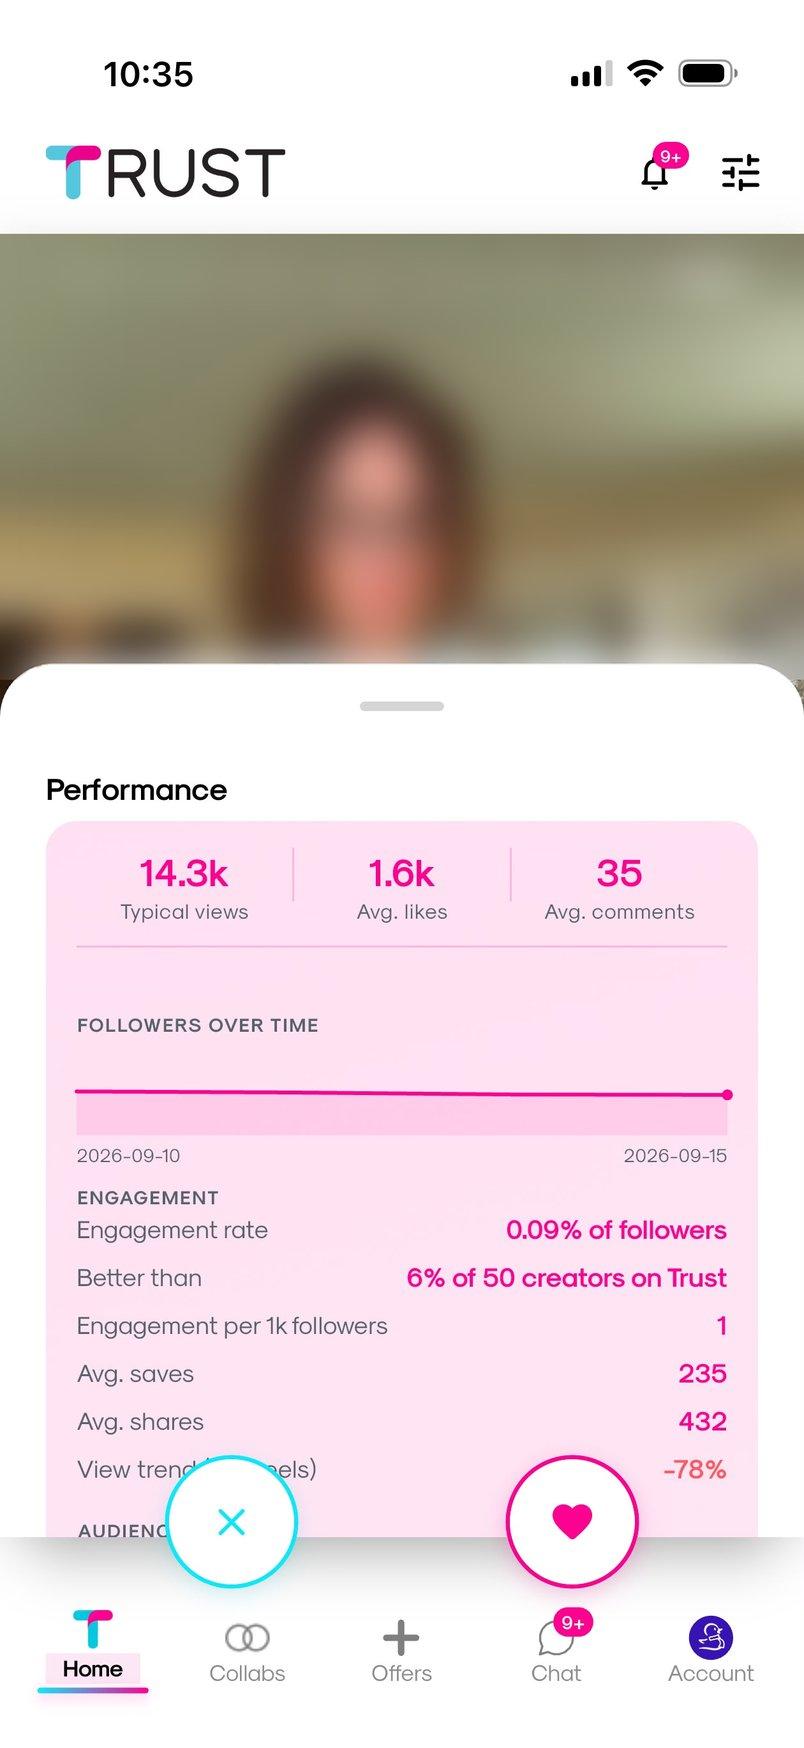
The brief was to make it more visual and easier to read, without losing any data.
Organizing by question
I took inventory: 39 data points. I regrouped them by the question a business is asking, not by where the data comes from.
The same 39 metrics, before and after. None is lost: they just move. The client asked to remove one, fake followers, because it was an estimate without reliable data.
›See the 39 metrics by block
Summary
- Typical views
- Avg. likes
- Avg. comments
- Engagement rate
- Better than X% of creators on Trust
- Avg. views · last 7 days
- Avg. likes · last 7 days
- Engagement rate · last 7 days
- Methodology note (posts analyzed)
Reach
- Followers over time (chart)
- Followers
- Following
- Avg. views (incl. viral posts)
- Views per follower
- Followers · last 7 days
Audience quality
- Women / Men
- Gender known for
- Likely fake followers (removed by the client)
- Verified followers
- Private followers
Engagement
- Engagement per 1k followers
- Avg. saves
- Avg. shares
- View trend (last reels)
- Best reel
Activity
- Posts per week
- Posts all time
- Posts in last 60 days
- Reels in last 60 days
- Last post
Account
- Account type
- Category
- Verified on Instagram
TikTok
- TikTok followers
- TikTok typical views
- TikTok avg. likes
- TikTok avg. comments
- TikTok engagement rate
- TikTok posts per week
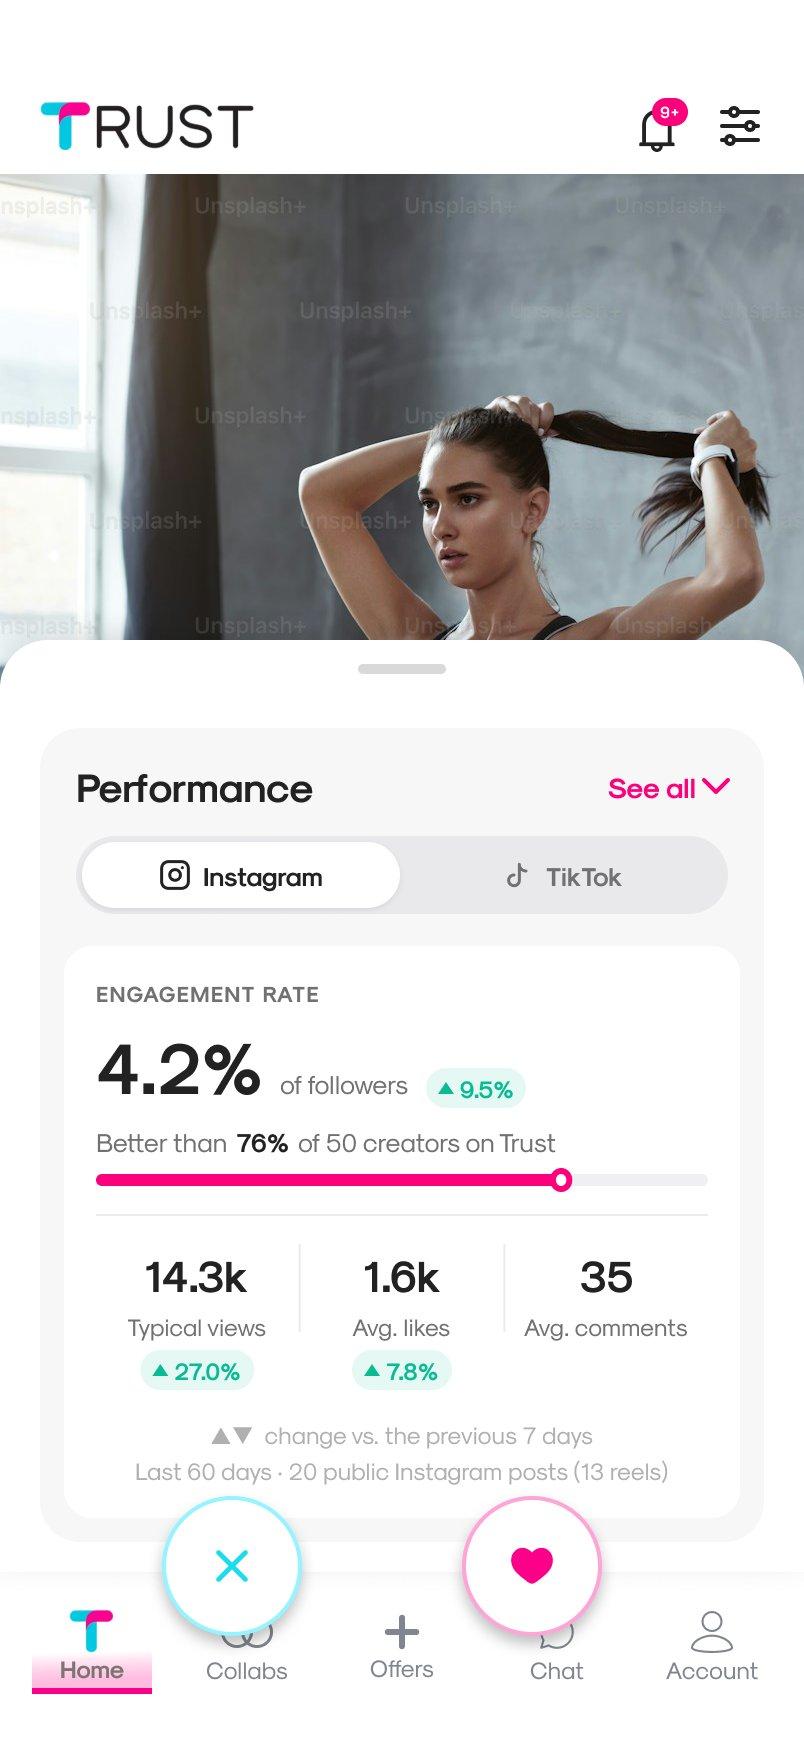
A summary at the top
Engagement, how it compares with other creators, and average views, likes and comments.
Each change, next to its figure
The growth block goes away: each change becomes a ▲▼ arrow.
Pink as an accent
Neutral backgrounds and figures in black, so pink only marks what you need to look at.
Two ways to show it
I explored both: everything in view in a single scroll, or a summary with the details in expandable blocks and a selector between Instagram and TikTok. I went with the second, on mobile and desktop: the summary reads at a glance and each network has its own tab.
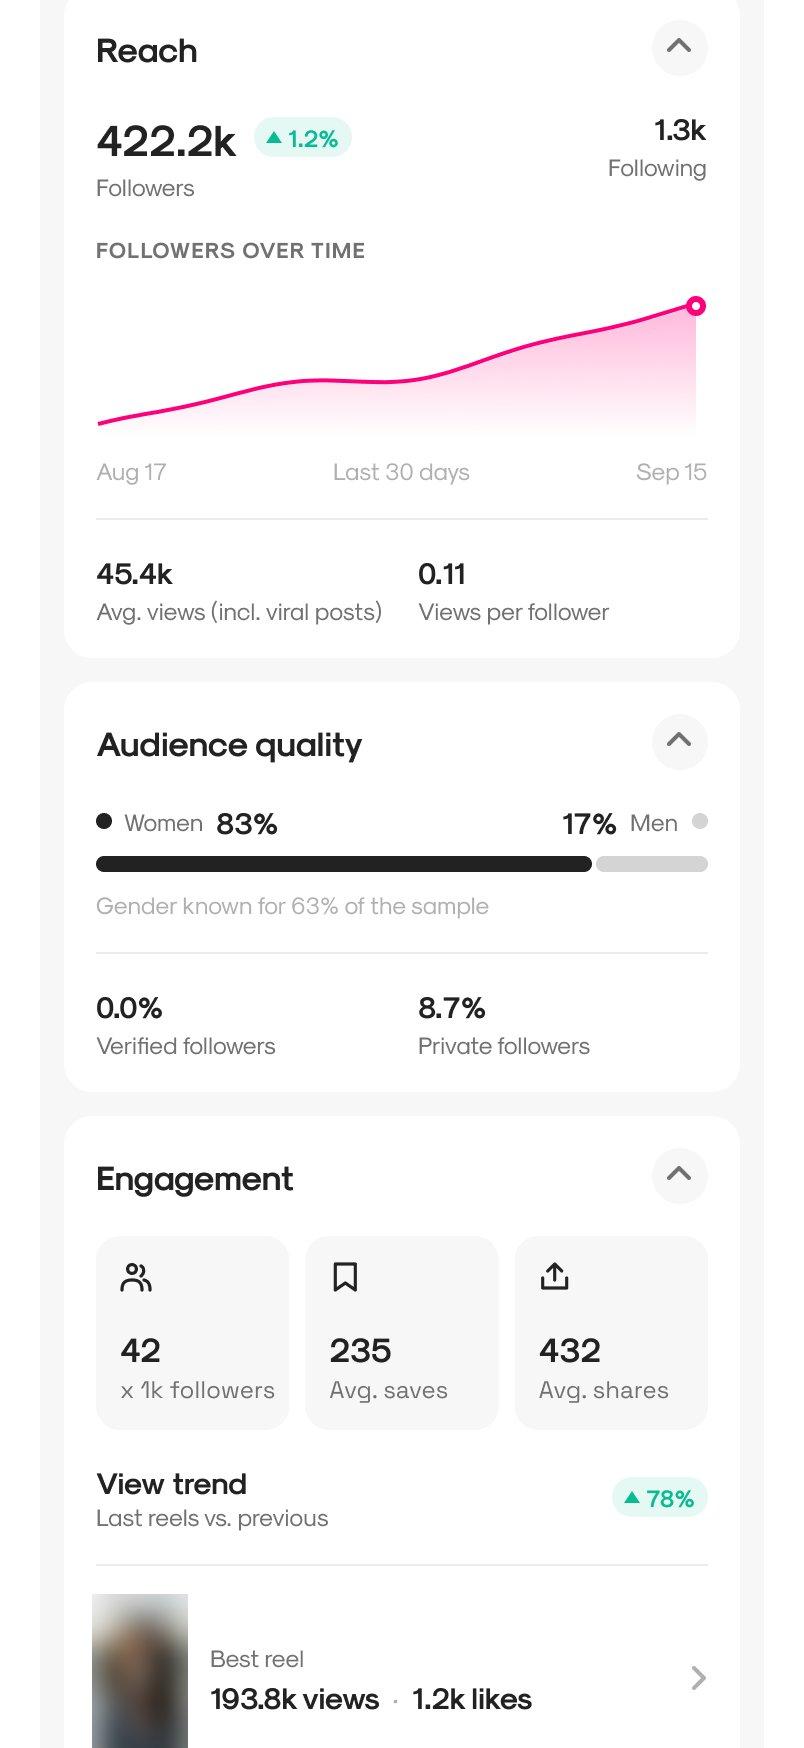
Instagram, expanded
Tapping “See all” opens all the blocks, and each one can be collapsed: the client read “see more” as seeing everything.
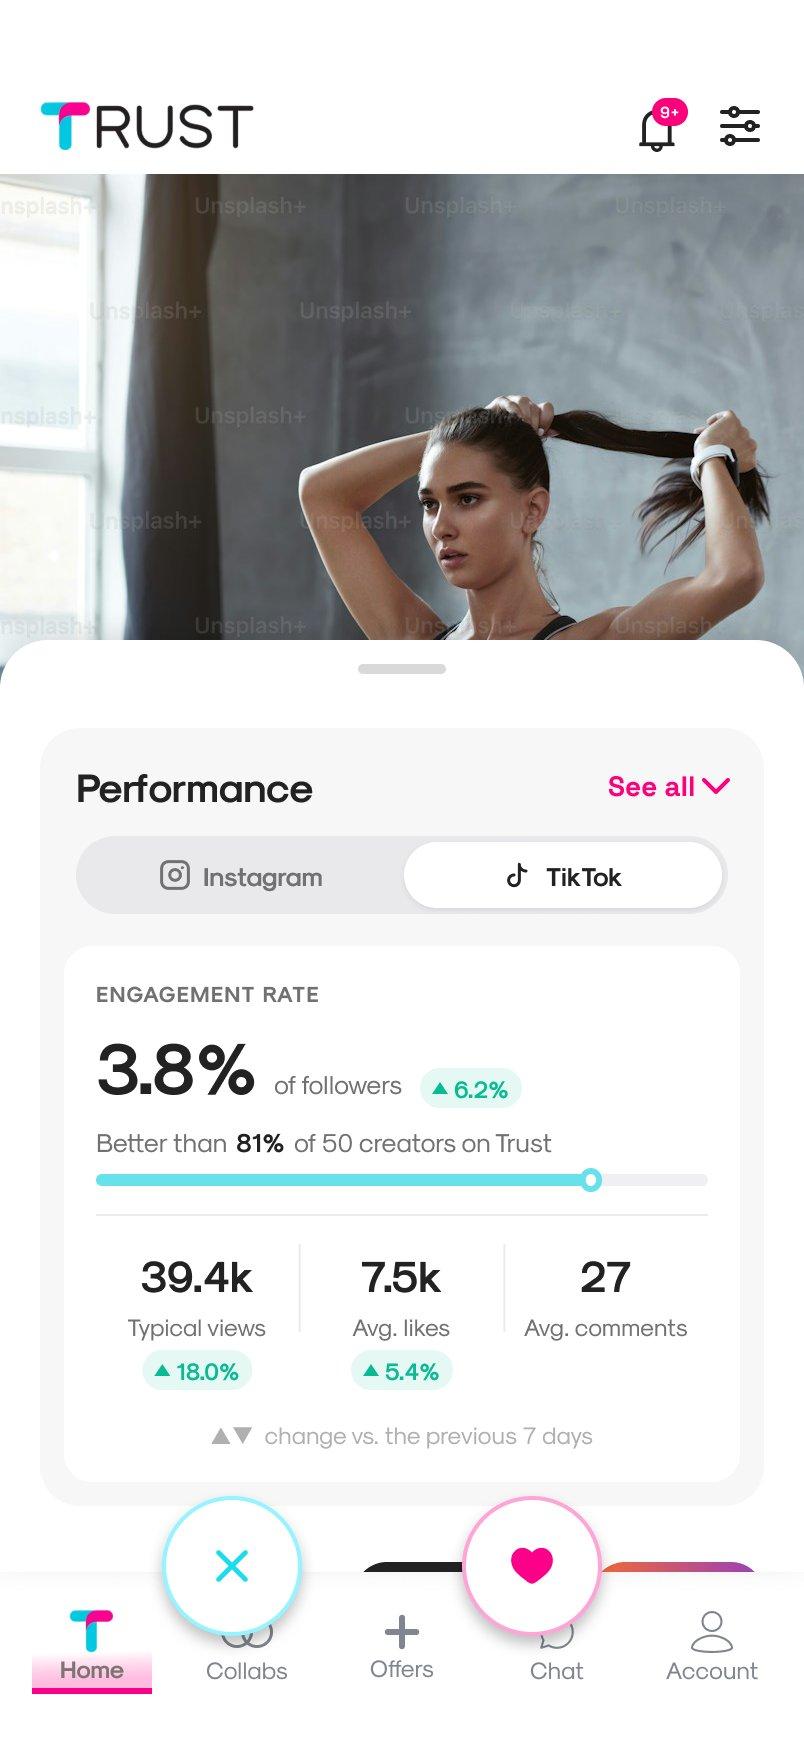
TikTok
The same structure as Instagram, ready for when it has the same metrics.
What the client asked for
Before seeing the designs, the client sent me their priority metrics. They confirmed the summary and led to three adjustments:
Remove fake followers
It was an estimate without reliable data.
Move audience quality up
Right after reach.
Bring the following count to the top level
Under the follower count, without expanding anything.
On desktop
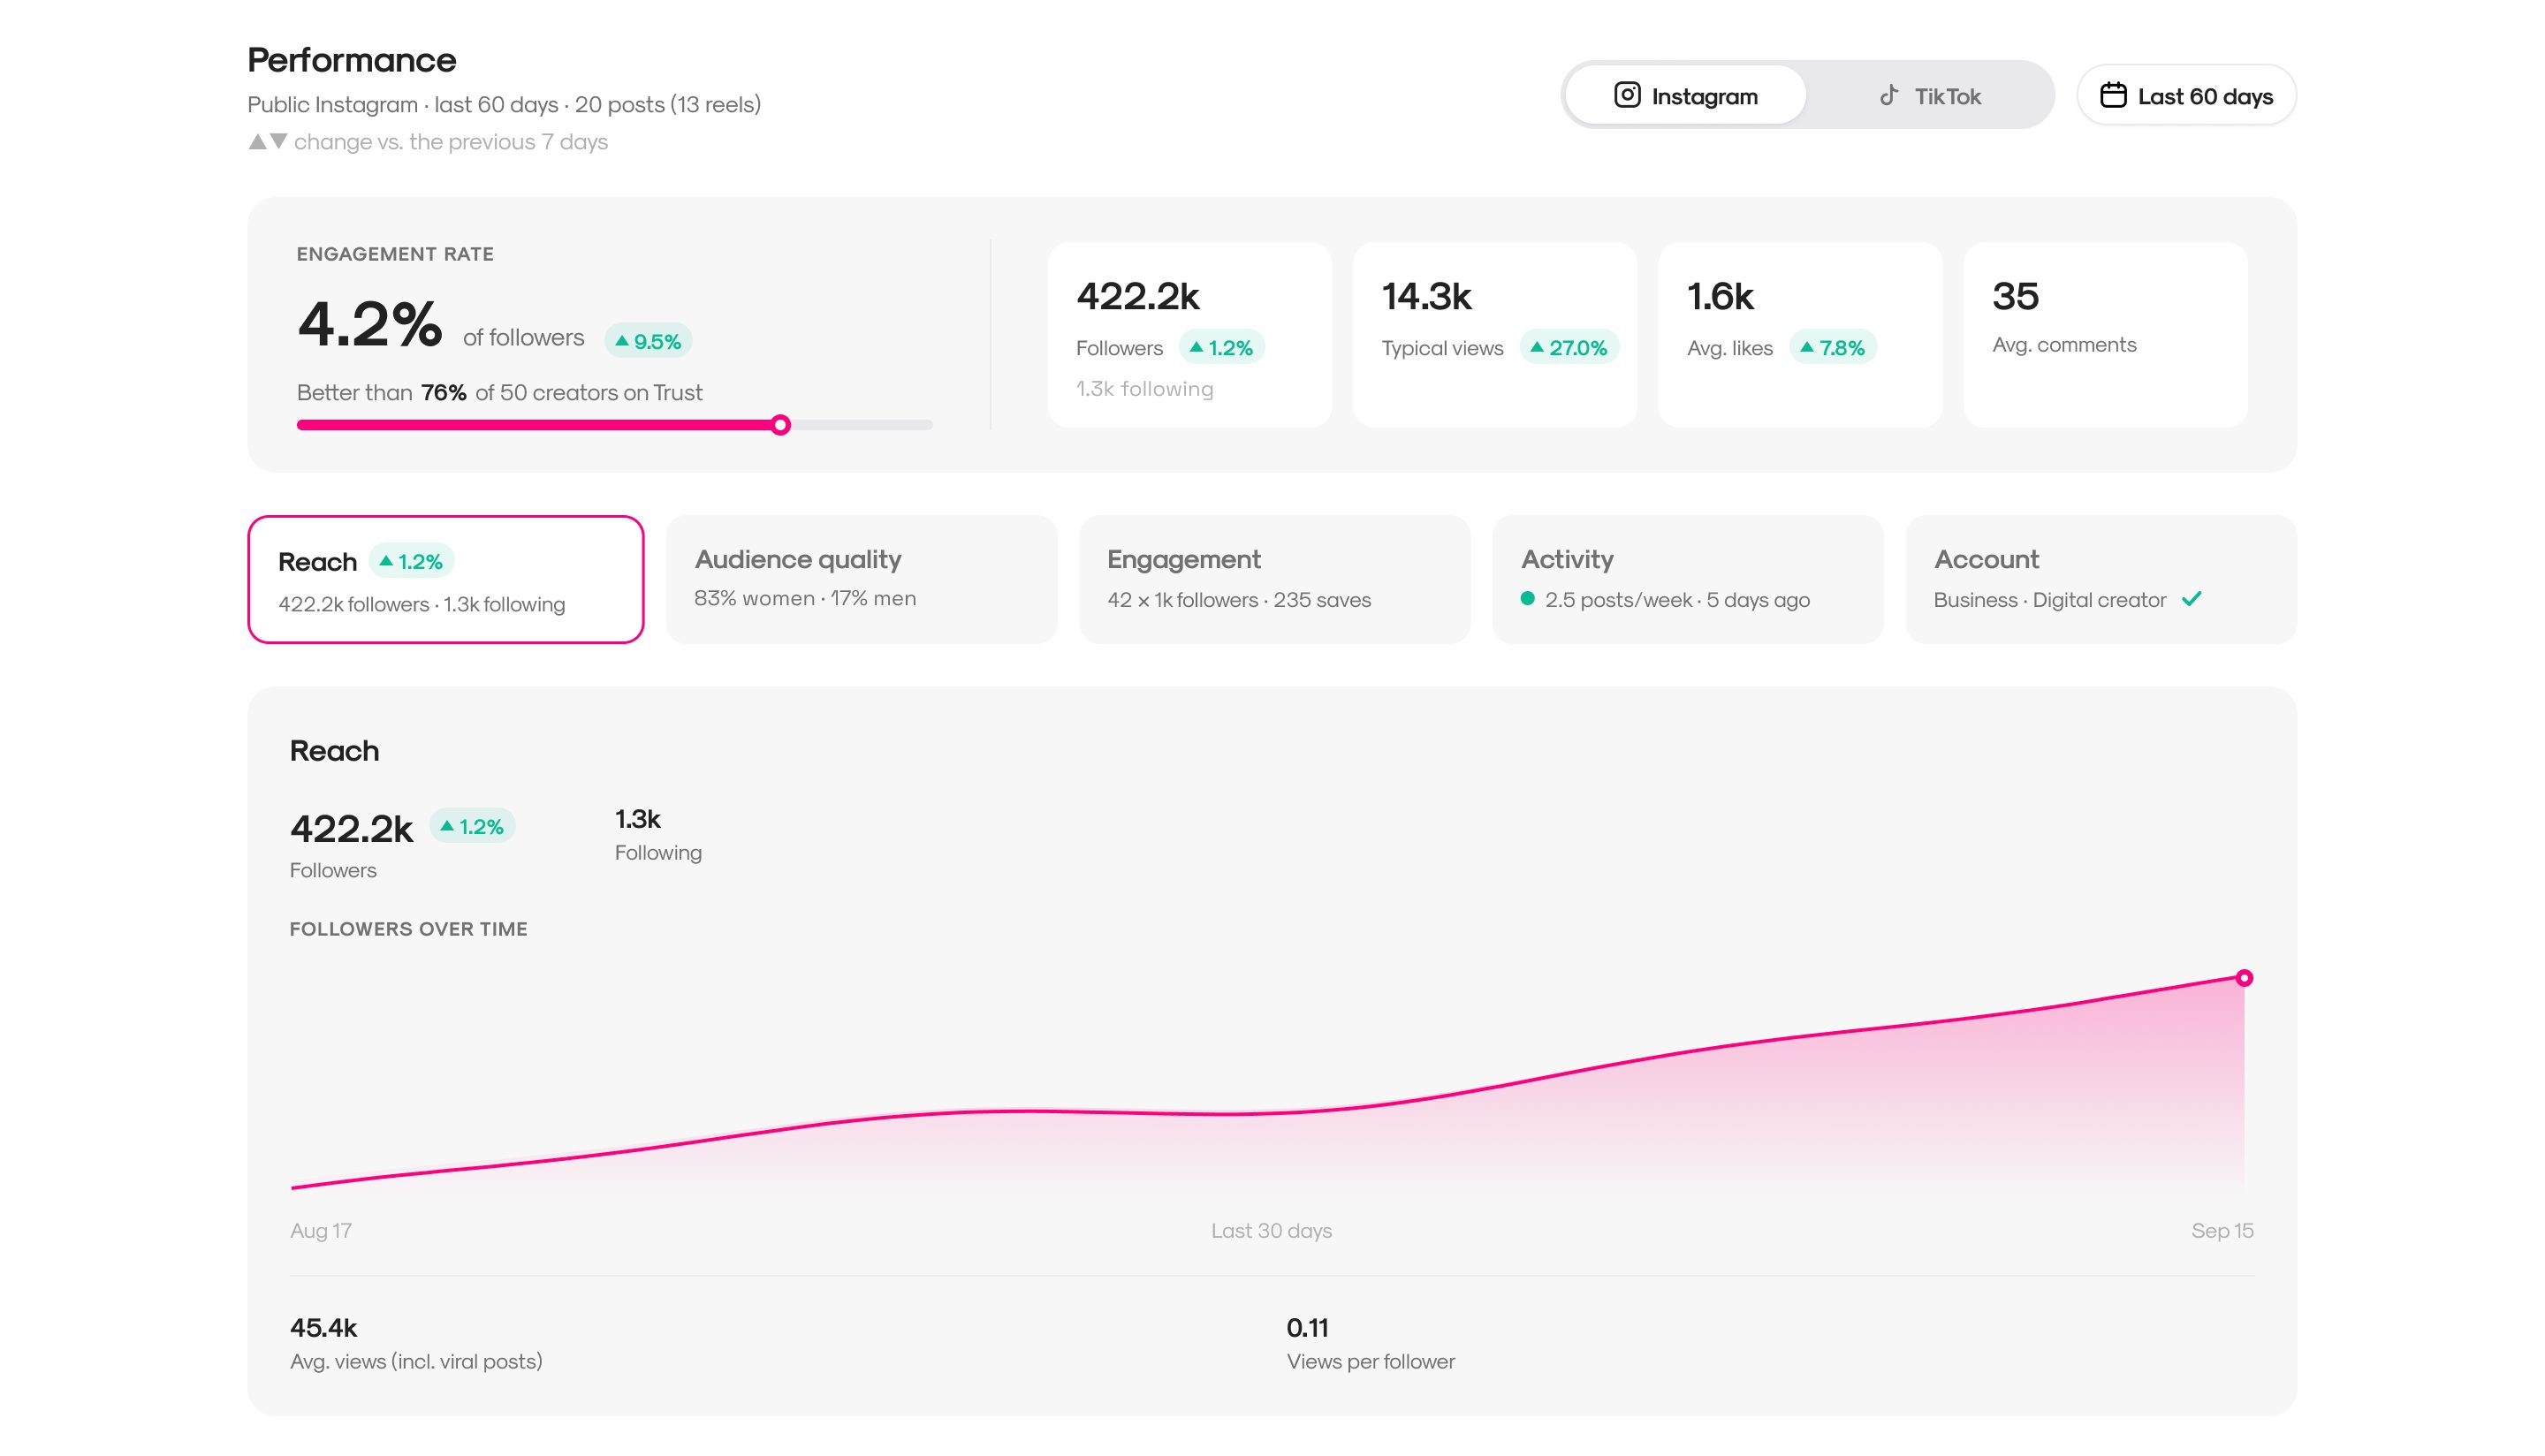
The metrics appear in two places, with two levels of detail. In the swipe, a minimal summary next to the offer, because all you do there is decide. In the creator's profile, the full analysis, with one tab per block that already shows its key figure.
The handoff
I delivered it in Figma, with clickable mobile and desktop prototypes, the components, and notes for development on which data goes in each block and how each part behaves. Since their team turns designs into code with AI, I named the layers after what they are, so the tool can understand them.
I used positive demo data and flagged it: with the example creator's real data, all negative, the design looked bad even though it wasn't.
Results
Much of the app, redesigned
From the swipe to each creator's metrics, on mobile and desktop.
The CEO wants to keep working with me
In September I was invited to appear as a designer on the company's LinkedIn page.
Let's talk.
I can walk you through any of these projects in more detail, including the screens I can't publish here.